Analytics
The analytics screen allows you to analyse and drill down into the details of your raw sales data imported into ampsuite. It should be noted that the analytics screen deals purely with imported sales data and does not take into account other accounting related amounts such as expenses, manual adjustments or contract percentages. As such it should not be used as a substitute for generated statements but as a tool for general analysis of sales trends and management reporting.
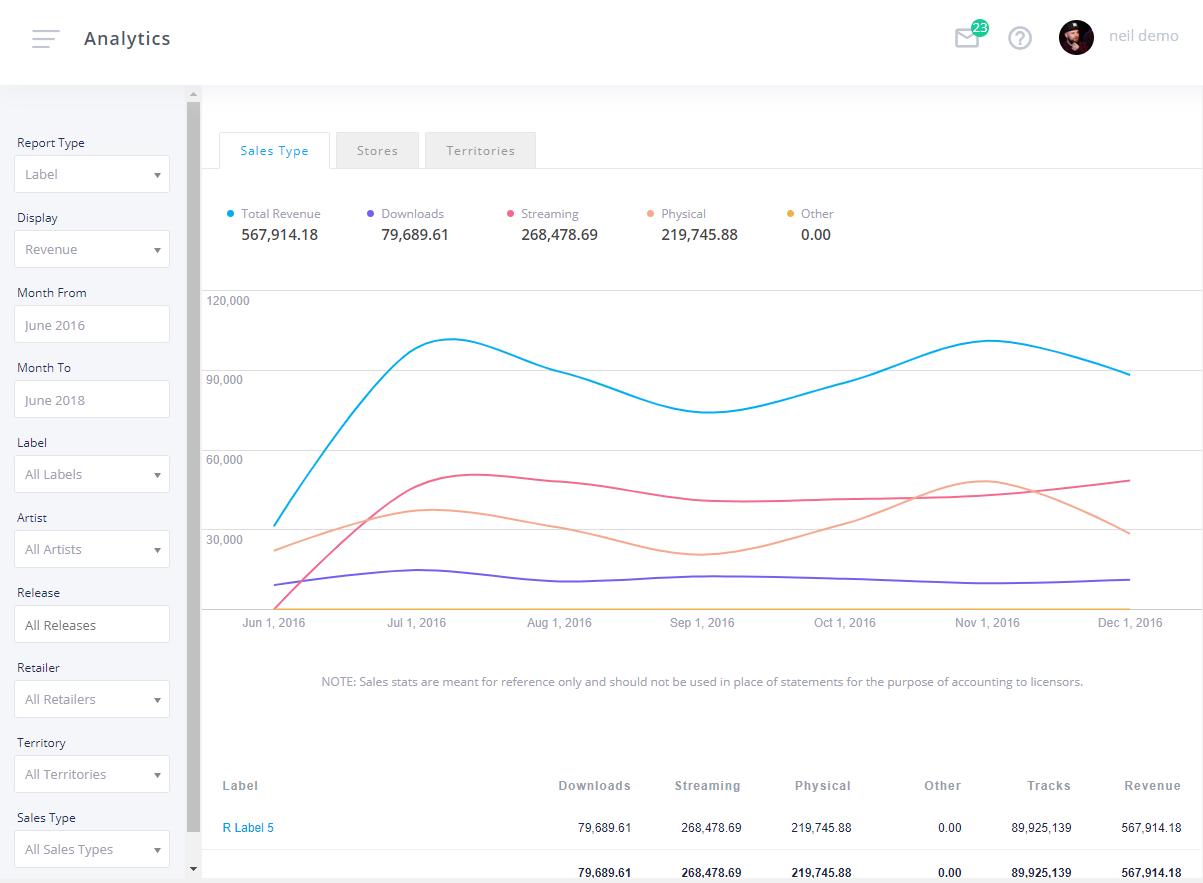
Due to the varied nature of statements provided by stores/distributors data is only displayed to a monthly level, for the most part the dates are based on the date selected when importing the file rather than contained in the imported files. One exception to this rule are quarterly Beatport statements which use the real sales month to prevent 3 monthly 'spikes' in the data when these are imported. Please note that it has not been possible to perform this smoothing of Beatport sales data for files imported prior to the release of the analytics module so you may still see spikes in your historical beatport data.
The screen allows for 3 main types of report - Sales Type, Stores and Territories. You can choose the type of report you wish to view by clicking one of the 3 tabs at the top of the graph.
When either Stores or Territories are selected the graph/table will display the 'top 5' categories based on revenue within the currently selected filters with all other values falling to the 'other' category. This means that graph lines and columns may change for these two report types depending on your current filter selection.
IMPORTANT: There is a slight delay between a statement being imported and the data being reflected in the analytics page due to additional data processing required prior to display. A warning message will be displayed below the graph if there are statements processing which have not yet fully updated.
Filtering Data
Data can be filtered in a number of ways with the use of various combinations of filters allowing for detailed analysis of your sales
- Report Type - This drop down changes how data is grouped into rows in the lower table section of the screen. Please note that depending on the amount of data in your system choosing options other than 'Label' with no filters applied may result in a large number of rows being returned (for example ALL tracks on your system) so it is advised to apply the relevant filters before changing this drop down in such situations.
- Units / Revenue - You can switch between whether the graph and table columns show either unit sales or revenue. The table will also show total revenue and tracks sold (or streamed) regardless of this selection. Note that a unit in this case is a single track sold - so the sale of a physical cd containing 10 tracks would count as 10 'units'. There is no distinction between track downloads and streams - a single stream of a track counts as one 'unit' as does a single download.
- Date Range - Select the date range for data to be displayed. Note that only imports with no outstanding errors will be included within the report. It does not matter if the imports have been finalised or used in statements yet.
- Other Filters - Additional options such as Label, Artist, Retailer, Territory and Sales Type all filter based on the data present within the imported statements. Note that this is partly dependent on correct assignments being applied during import - e.g. if you do not map all unknown territory codes then you may get lots of sales appearing under Other / Unknown rather than the actual territory of sale.
'Drill Down' Link
You can click on a row within the table underneath the graph to drill down into the next level of data. E.g. clicking on a label will drill down to show all releases in that label whereas clicking on a release will drill down to show all tracks on that release. Be aware that 'drilling down' into data using the links within the table rows may automatically add/remove filters to display the relevant level of data. You should be careful to make sure that only the filters you currently wish to be applied are selected in the left hand filters column if you've drilled in and out of rows multiple times between filter selections.